The Google Search Console is a helpful tool that provides valuable insights for helping you to optimize your website. In this article, we give you an introduction to the new Search Console, and explain how to use the additional features.
After several months of testing, the new version of the Google Search Console was made available to all users at the end of January 2018, and offers webmasters many new features. Among other things, users now have access to historical data from 16 months (instead of 90 days as before). Other new functions include for example the Index Coverage Report, meaning you can track the performance of individual URLs in search.

Figure 1: Google announces the launch of the new Search Console in the Webmaster Central Blog.
The Google Search Console has become a real multi-tool for web analysis. Standard functions include storing the sitemap.xml and analysis of indexable pages, and the tool also provides useful information regarding possible HTML errors in title and meta-descriptions.
Are you curious? Let’s take a closer look at the features of the new Search Console. Below, we list ten common questions about using the new GSC:
1. How can I determine rankings with the new Google Search Console?
The new interface in the “Status/Performance” area contains the search analysis, one of the core features of the Search Console. You can access the search analysis via the dashboard by clicking on “Open Report” in the performance view.

Figure 2: Google Search Console Dashboard with Performance report
Here you can determine the rankings of your search terms with the Search Console. The report is simple and clearly arranged, and in the upper area you can sort clicks and impressions by web, video or pictures.

Figure 3: Performance report in the Google Search Console
In the central view of the performance report, there are four tabs at the top:
- “Total clicks”
- “Total impressions“
- “Average CTR“
- and “Average position”
To display individual rankings for pages, search queries, countries or devices, you can activate the tile “Average position” by clicking on it.

Figure 4: Show rankings in the Google Search Console
2. Which time frames can I use to analyze my data?
The analysis period can be set individually in the new Google Search Console. Data from a longer period (up to 16 months) can now be analyzed. Previously, only data from the previous 90 days could be analyzed.
Simply set the desired analysis period by clicking on the “Date” button within the filter bar.

Figure 5: Analysis date range
3. How do I determine the rankings of individual pages?
To find out which individual URLs of your website rank, click on the tab “Pages”.

Figure 6: Filter rankings according to pages
Now, you will see the average ranking position of your pages, giving you a useful overview of which of your pages have the best rankings.
You can also filter this information by clicking on the filter symbol. For example, you can filter to get an overview of pages that have an average ranking position of less than 20.
4. How do I filter my rankings according to certain keywords?
For seeing clicks and impressions, click on the filter symbol and check the box “queries”. Then a box will appear where you can enter your search term.

Figure 7: Filter queries according to search terms
A further practical filter makes sorting according to rankings easy. For example, you can choose to just see pages that rank on the first page.

Figure 8: Filter queries according to position
You can see all keywords for which you rank lower than position 10. For example, you can set a filter so that you see all pages that rank between positions 10 and 20 (i.e. on the second page), to make optimizing your second page rankings easy. Pages that rank position 11 on average have a particularly high optimization potential.
5. How can I determine which pages rank with which keywords?
The Google search can show different search results depending on the user’s location or device. The new Google Search Console takes this fact into account.
Click on a keyword in your ranking overview and then on the “Pages” tab. The rankings for this keyword are displayed in relation to the ranking URLs of your website.

Figure 9: Rankings of individual pages for a search query
6. How do I compare rankings according to country?
If your website is offered in different countries, a country comparison is very useful. Click on the performance analysis on the tab “countries”.

Figure 10: Average position according to country
If you want to determine how your rankings differ in individual countries, you can add a filter.

Figure 11: Rankings of individual keywords by country
You can also get the same result by clicking on the rankings of a search term and then selecting the “Countries” tab.
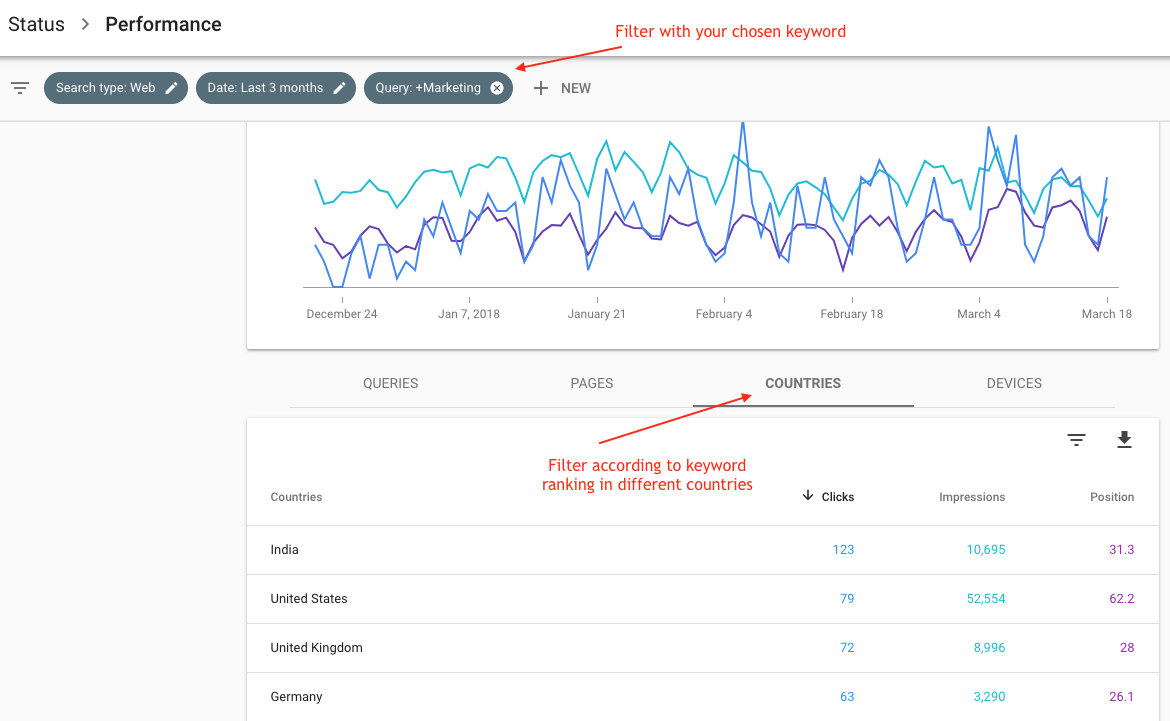
Figure 12: See individual rankings ordered according to countries
7. How do I compare my rankings on mobile and desktop?
Through a comparison of mobile rankings and desktop rankings, you can, for example check whether your website performs as well in the mobile SERPs as it does in the desktop search. You get a global ranking comparison between your devices when you click on the tab “Devices” in the performance report.
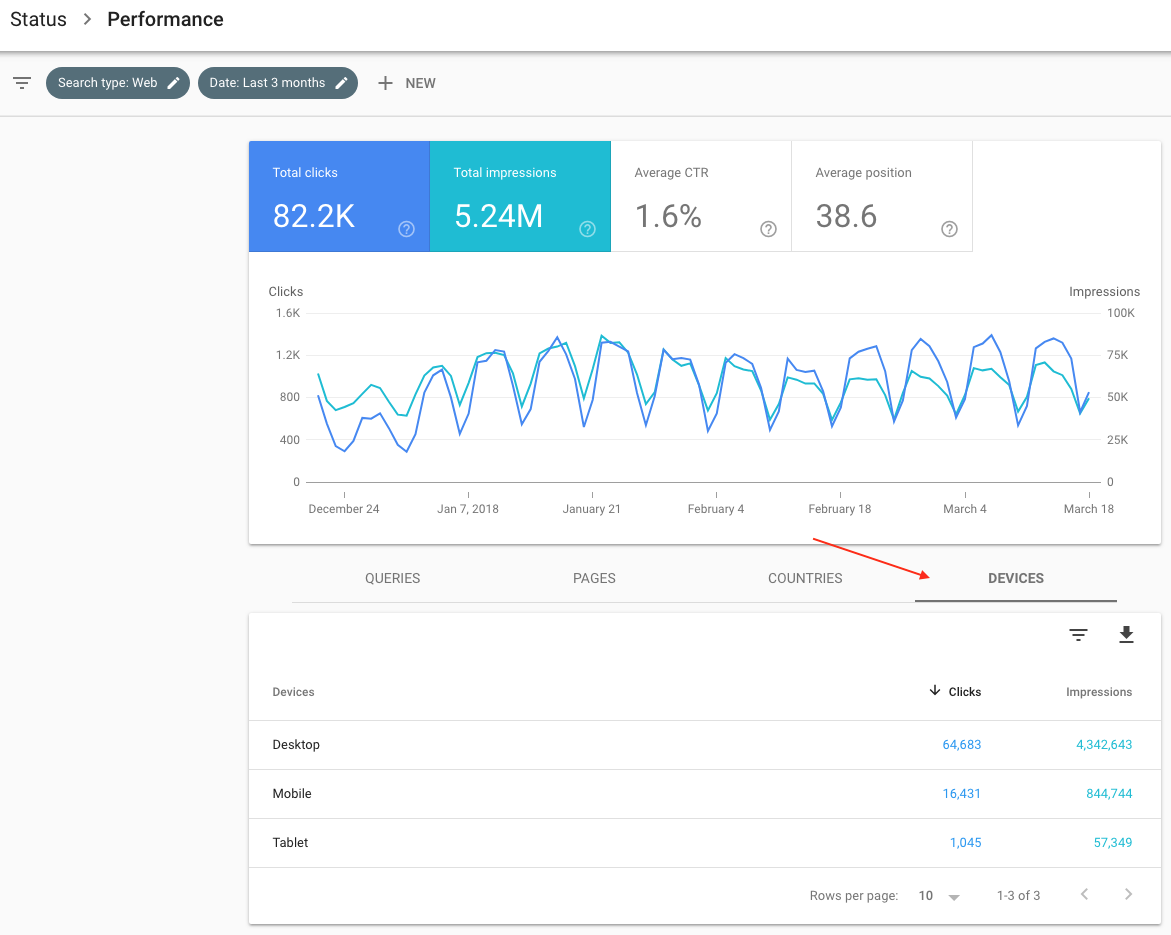
Figure 13: Average rankings according to device
8. How can I create a ranking comparison over different time periods?
Rankings are never static, but change daily. With the comparison of different time periods in the Google Search Console, you can see how your rankings have changed over time.
You can determine the comparison period individually by clicking on the filter button “date” and then “Compare”
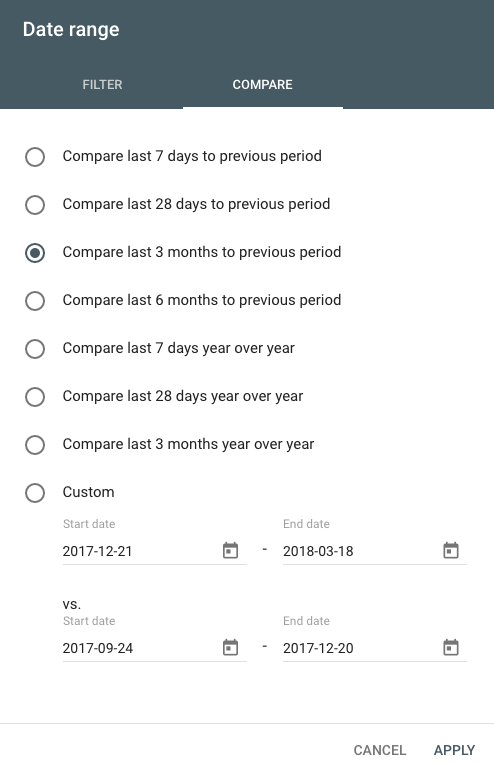
Figure 14: Compare different time periods with the Google Search Console
At the same time, further filters can be set according to search queries. By clicking on the tab “queries” you will now receive a three-month comparison of rankings for specific search queries:
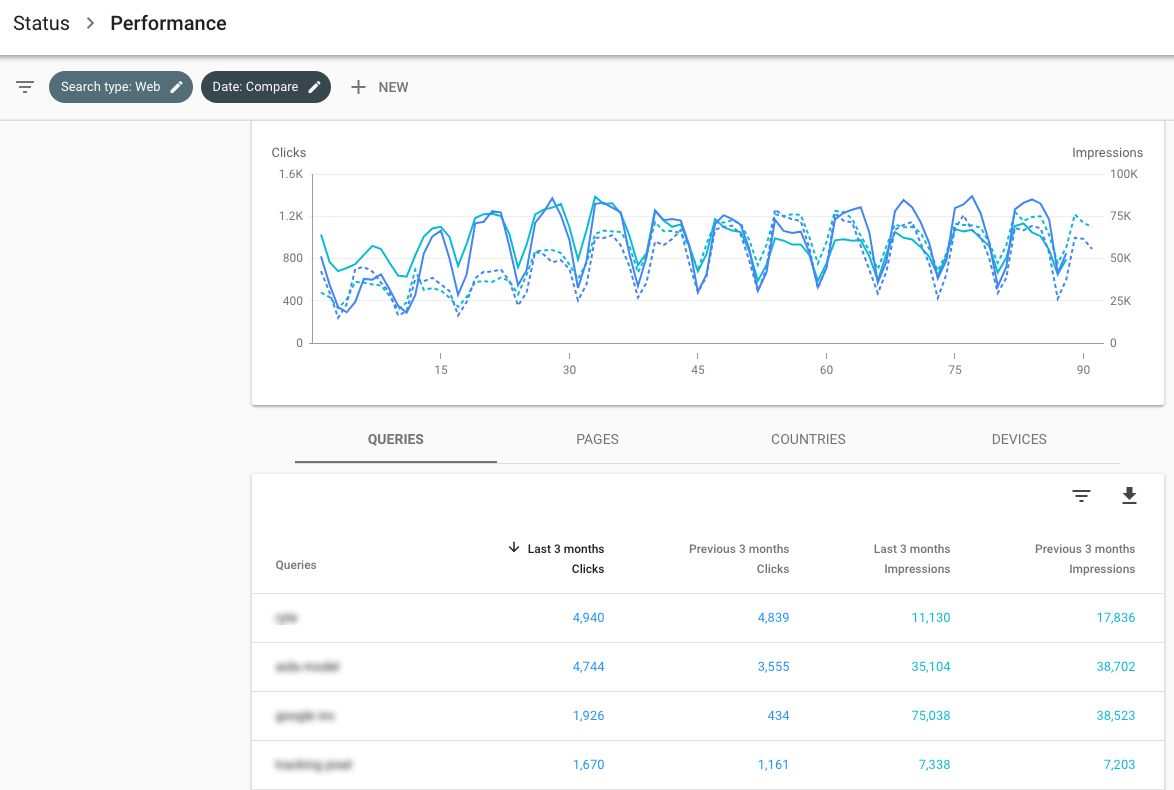
Figure 15: Compare rankings from two different time periods
The analysis is also useful for limiting possible losses in ranking over time. The position analysis can then show you the ranking development of your website over the course of a year or longer, for example.
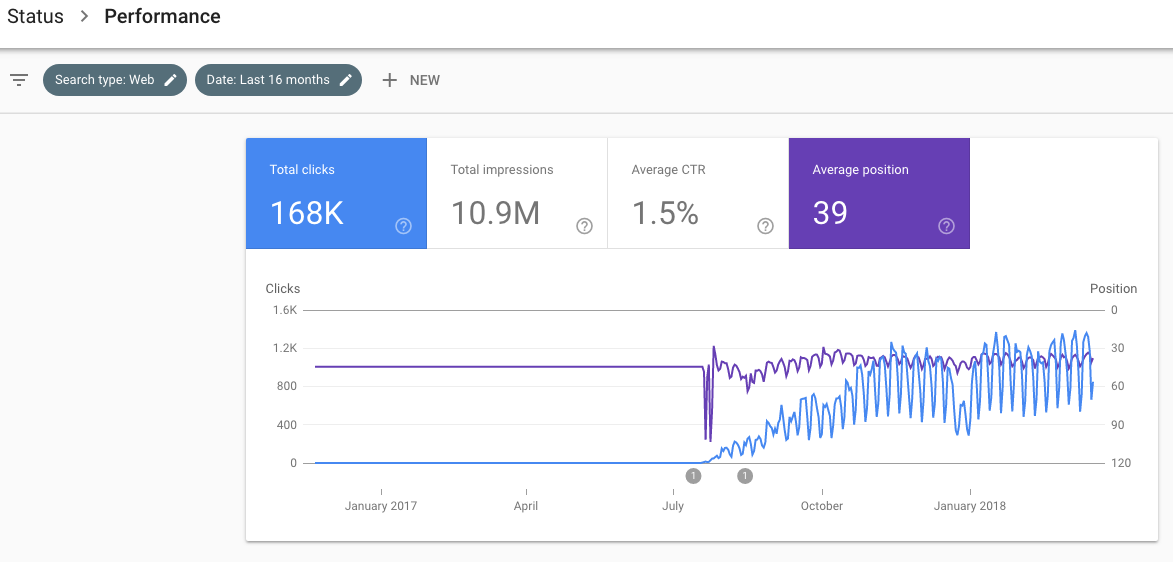
Figure 16: Analyze average rankings over 16 months
9. How do I analyze my ranking data in combination with my click rate?
With a click on the tab “average CTR”, all data will be combined with the click rate in the SERPs.
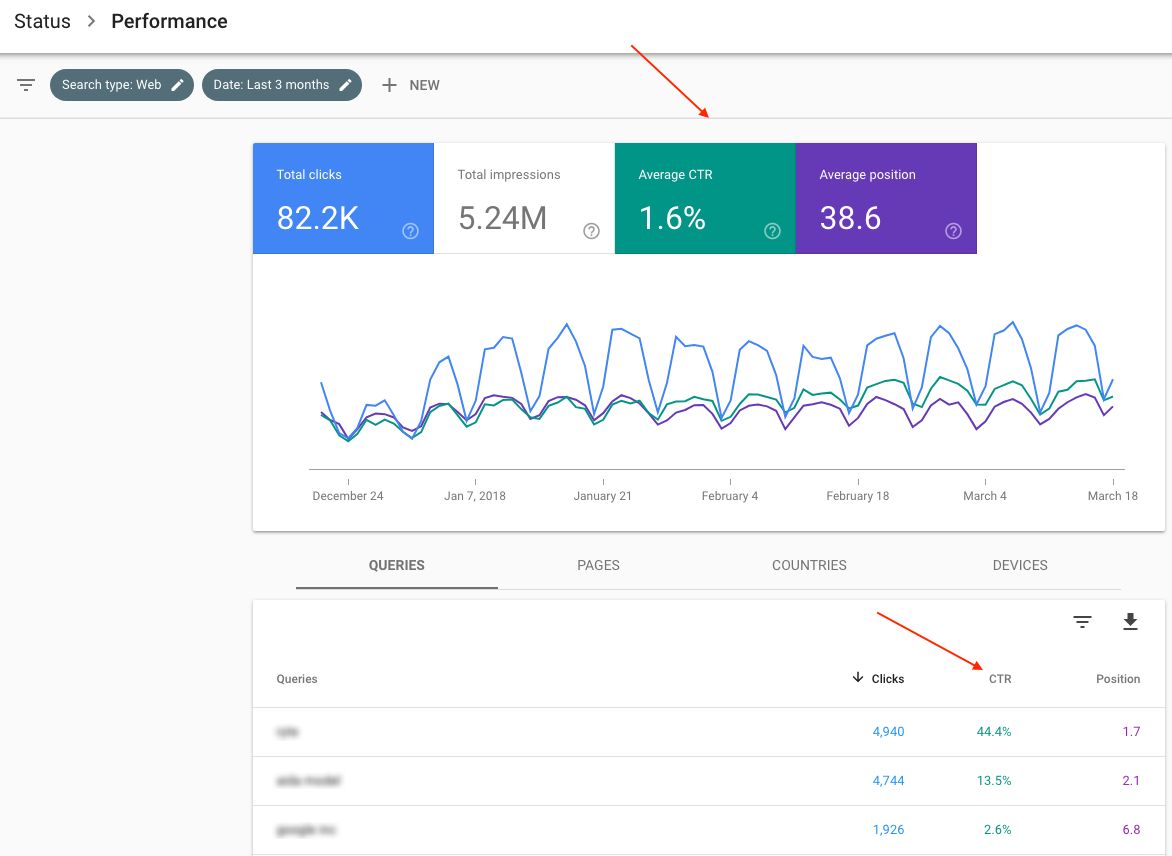
Figure 17: Analyze rankings with CTR
10. How can I export my data?
Exporting the data is very intuitive. In every analysis, you can see the download icon. When you click on this, a menu will open and you will be asked wither you want to export the data as an excel sheet or google sheets.
When you use the Google Search Console, you are already logged in to your Google account, so if you click on Google sheets, the table will open immediately in a new window. This can then be exported or worked on directly.
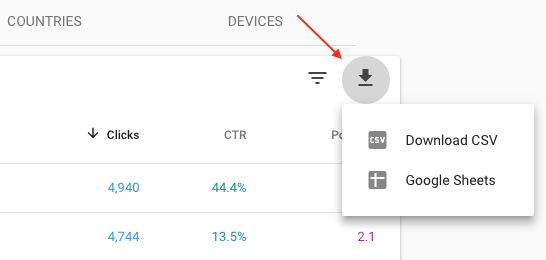
Figure 18: Export data with the Google Search Console
[kc_row use_container=”yes” _id=”860821″][kc_column width=”12/12″ video_mute=”no” _id=”236575″][crum_title title=”Read Also” _id=”964231″ type=”h1″ inline_link=”yes” title_link=”https://digiprad.com/search-engine-blog/|Search Engine Blog|” css_custom=”{`kc-css`:{`any`:{`box-style`:{`text-align|`:`center`}}}}”][kc_row_inner column_align=”middle” video_mute=”no” _id=”591317″][kc_column_inner width=”100%” _id=”939787″][crum_post_slider layout=”portfolio” number_of_items=”3″ dots=”yes” autoscroll=”yes” time=”5″ number_post=”9″ _id=”214799″ dots_position=”top” post_taxonomy=”post:search-engine-blog” order_by=”ID” order_list=”ASC”][/kc_column_inner][/kc_row_inner][/kc_column][/kc_row]
Conclusion
Ranking data is an important KPIs for measuring the success of your optimization measures. You should constantly analyze your rankings and observe changes closely.
[crum_call_to_action layout=”center” title=”Tell Us About Your Project” desc=”Q2hhdCB3aXRoIHVzIG9uIHdoYXRzYXBw” show_link=”yes” btn_size=”large” _id=”953311″ link=”https://api.whatsapp.com/send?phone=2349067688122|We are online|_blank” btn_color=”primary” css_custom=”{`kc-css`:{`any`:{`title`:{`color|.heading-title`:`#ffffff`},`sub-title`:{`color|.heading-text`:`#ffffff`}}}}”]